Introduction:
Trading in financial markets is a complex endeavor that requires careful analysis and decision-making. Successful traders often rely on a combination of strategies and tools to gain an edge in the markets. Among these tools, trading indicators play a crucial role. In this article, we will explore some of the most successful trading indicators used by traders around the world.
Moving Averages:
Moving averages are one of the most fundamental and widely used indicators in trading. They smooth out price data to identify trends and reversals. Two popular types are:
a. Simple Moving Average (SMA): This indicator calculates the average price over a specified period, providing a clear trend direction.
b. Exponential Moving Average (EMA): EMA gives more weight to recent prices, making it responsive to recent market changes.
Moving averages can help traders identify trends, potential entry and exit points, and act as dynamic support or resistance levels.

Relative Strength Index (RSI):
RSI is a momentum oscillator that measures the speed and change of price movements. It ranges from 0 to 100 and helps traders identify overbought and oversold conditions. A reading above 70 suggests overbought, while a reading below 30 suggests oversold.
Bollinger Bands:
Bollinger Bands consist of a moving average and two standard deviation lines. They help traders identify volatility and potential reversal points. When the price reaches the upper band, it may be overextended, and a reversal could be imminent. Conversely, when it touches the lower band, it may be oversold.
MACD (Moving Average Convergence Divergence):
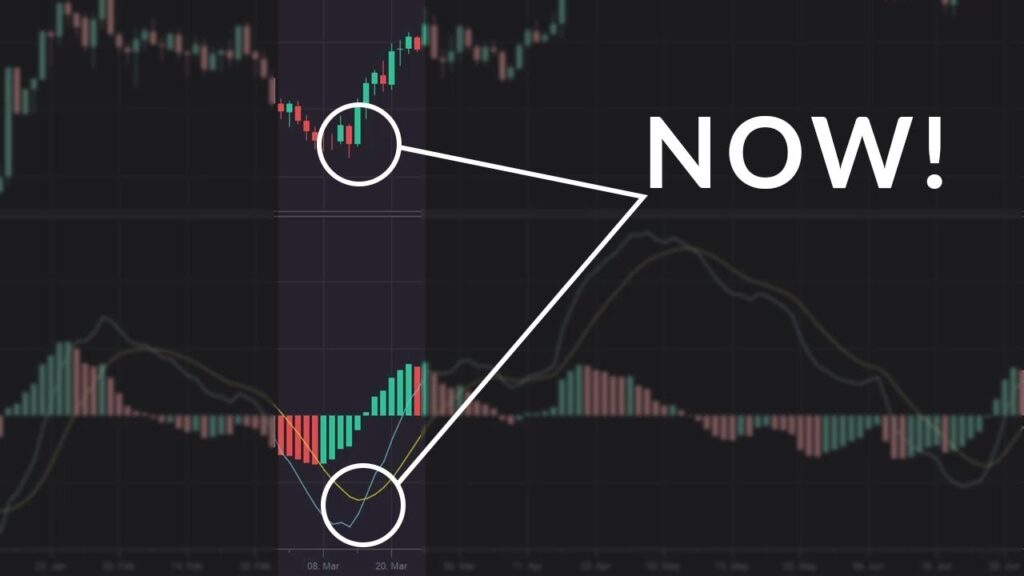
The MACD indicator combines two moving averages and a histogram to show changes in momentum. Traders use it to identify potential trend reversals, crossovers, and divergence between the indicator and price action.
Fibonacci Retracement:
Fibonacci retracement levels are based on the Fibonacci sequence and are used to identify potential support and resistance levels. Traders often draw retracement lines on their charts to identify areas where price may reverse.
Stochastic Oscillator:
The stochastic oscillator compares the closing price to a price range over a specified period. It helps traders identify potential reversal points and overbought or oversold conditions.
Ichimoku Cloud:
The Ichimoku Cloud is a comprehensive indicator that provides information about support and resistance levels, trend direction, and potential entry and exit points. It consists of several components, including the cloud, which represents potential support and resistance.
Conclusion:
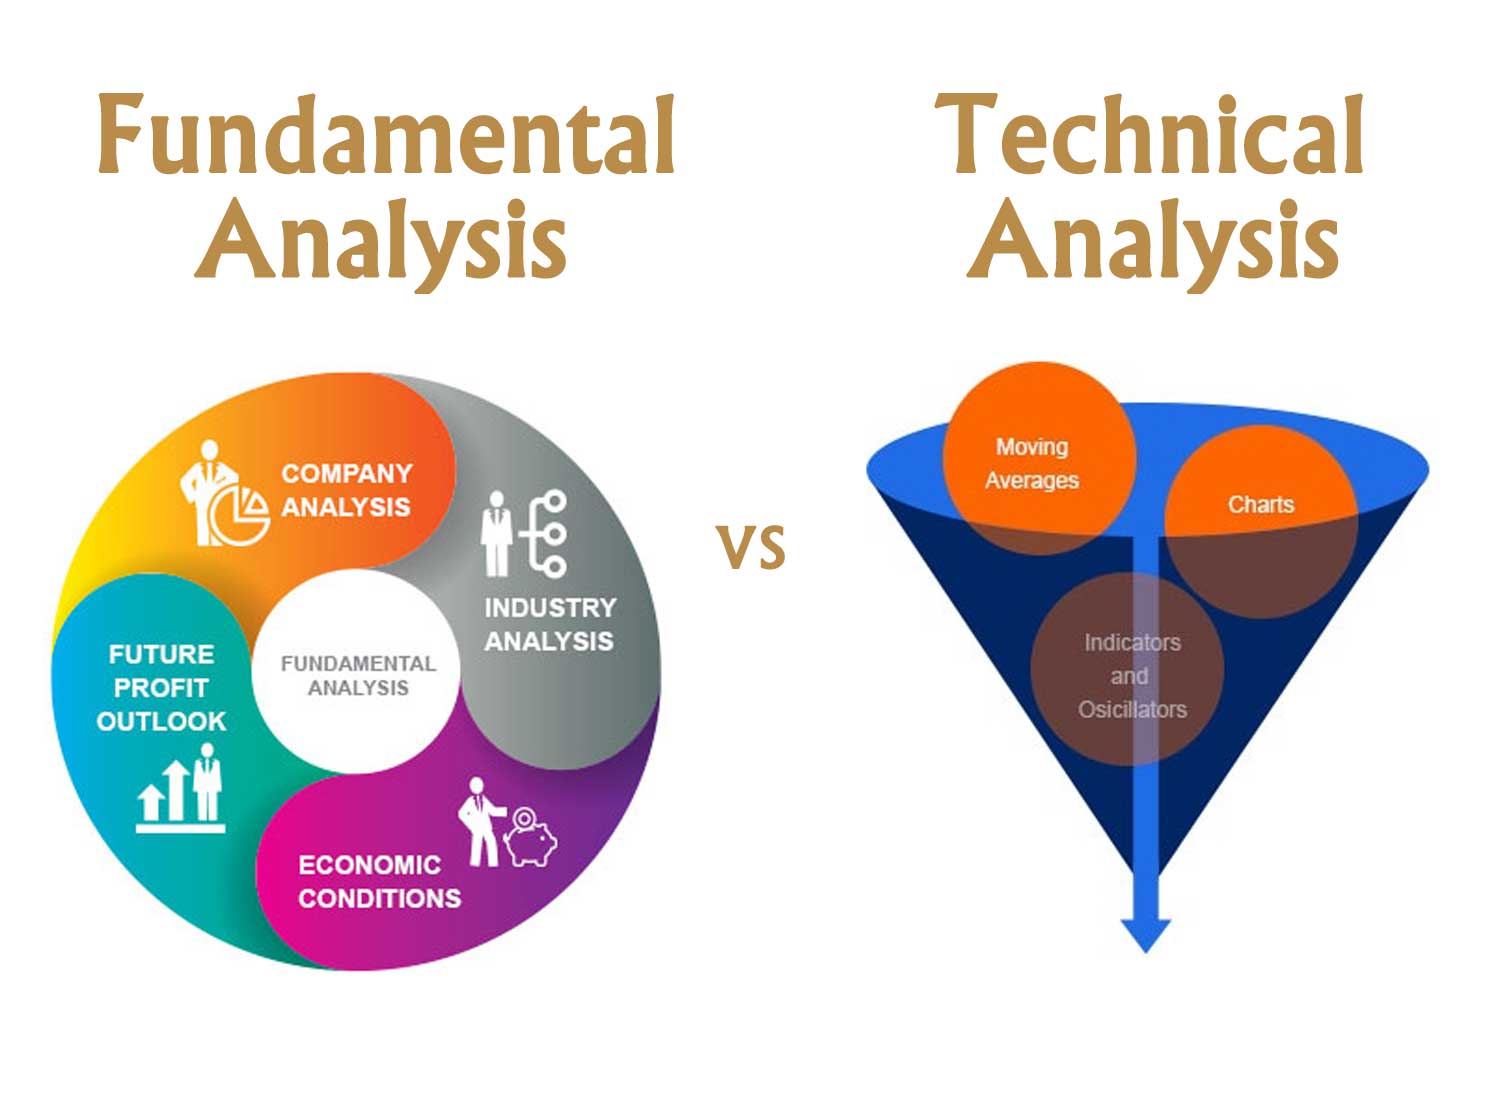
Successful trading requires a deep understanding of the markets and the tools available to traders. While these trading indicators can be powerful, it’s essential to remember that no indicator is foolproof. Traders often use a combination of indicators and incorporate other forms of analysis, such as fundamental analysis, to make informed trading decisions. Additionally, risk management and discipline are crucial aspects of successful trading. As you explore these trading indicators, remember that practice and experience are key to becoming a proficient trader in the ever-changing world of financial markets.


